Cron Monitoring
Don’t let your application suffer from flaky cron jobs. Know when your scheduled jobs fail, why, and (more importantly) where to fix the problem in your code.
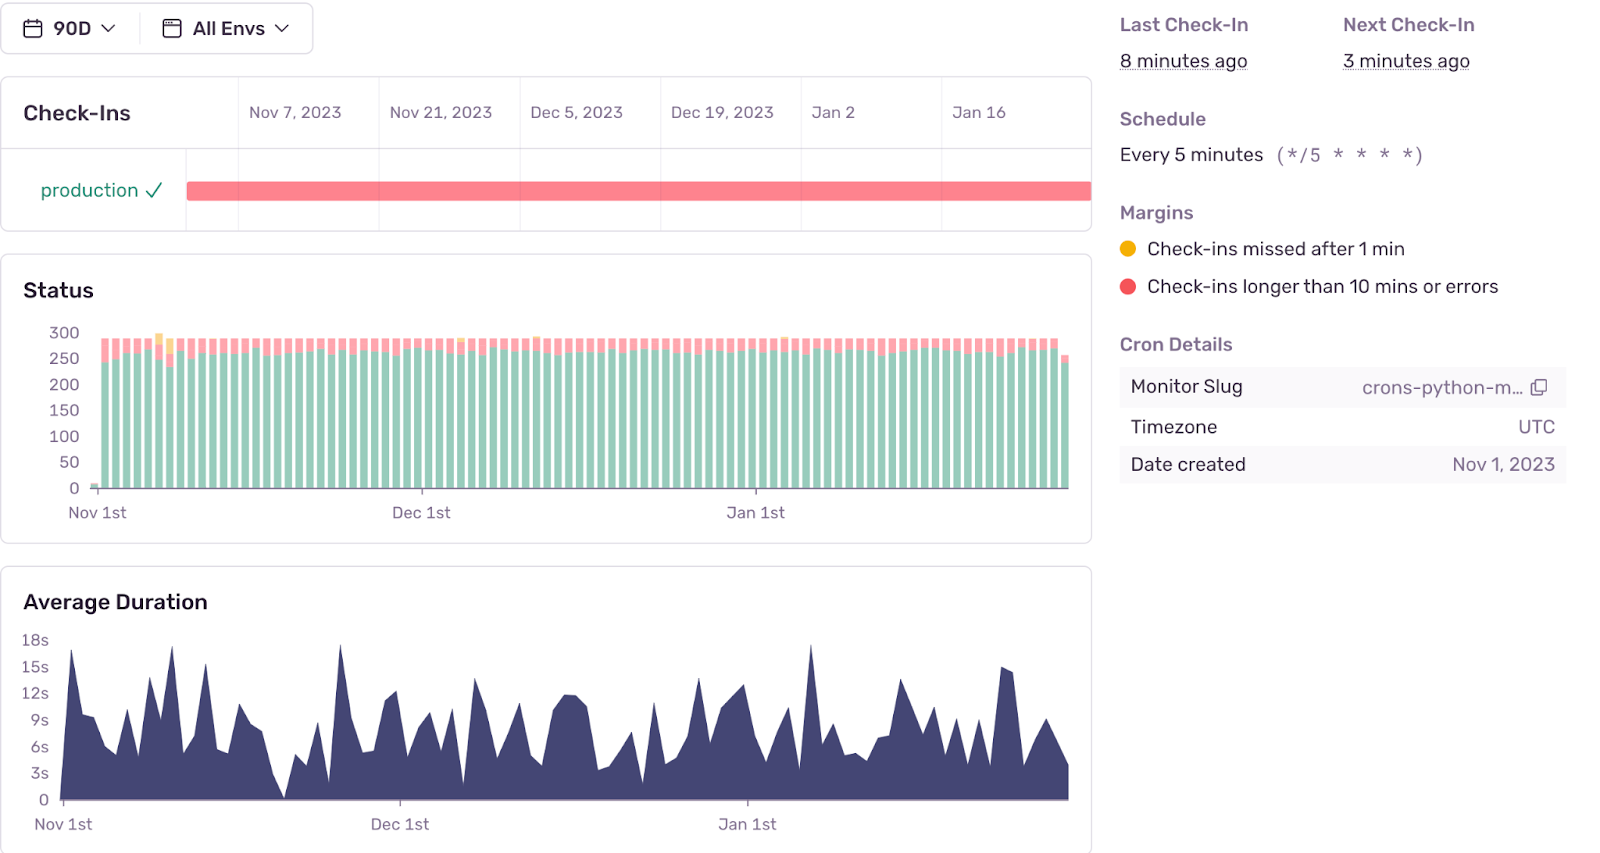
Track your scheduled jobs
Identify and solve for the root cause faster by viewing data from failed check-ins alongside related error issues.
Know which projects to prioritize based on issue frequency. See events across projects, including missed, failed, and successful check-ins.
Monitor the jobs your team cares about and notify them when they fail. Configure monitors by environment, schedule using crontab or interval - down to the minute.
Getting started with Sentry is simple
We support every technology (except the ones we don't).
Get started with just a few lines of code.
Just run this command to sign up for and install Sentry.
brew install getsentry/tools/sentry-wizard && sentry-wizard -i androidInstall the NuGet package to add the Sentry dependency:
dotnet add package SentryInitialize the SDK as early as possible, like in the Main method in Program.cs/Program.fs:
using (SentrySdk.Init(o => {
  // Tells which project in Sentry to send events to:
  o.Dsn = "https://<key>@sentry.io/<project>";
  // When configuring for the first time, to see what the SDK is doing:
  o.Debug = true;
  // Set TracesSampleRate to 1.0 to capture 100% of transactions for Tracing.
  // We recommend adjusting this value in production.
  o.TracesSampleRate = 1.0; }))
{
  // App code goes here - Disposing will flush events out
}
Grab the Sentry Go SDK:
go get "github.com/getsentry/sentry-go"Configuration should happen as early as possible in your application's lifecycle:
package main

import (
	"log"
	"time"

	"github.com/getsentry/sentry-go"
)

func main() {
	err := sentry.Init(sentry.ClientOptions{
		Dsn: "https://<key>@sentry.io/<project>",
    EnableTracing: true,
		// Specify a fixed sample rate:
		// We recommend adjusting this value in production
		TracesSampleRate: 1.0,
		// Or provide a custom sample rate:
		TracesSampler: sentry.TracesSampler(func(ctx sentry.SamplingContext) float64 {
			// As an example, this does not send some
			// transactions to Sentry based on their name.
			if ctx.Span.Name == "GET /health" {
				return 0.0
			}

			return 1.0
		}),
	})
	if err != nil {
		log.Fatalf("sentry.Init: %s", err)
	}
	// Flush buffered events before the program terminates.
	// Set the timeout to the maximum duration the program can afford to wait.
	defer sentry.Flush(2 * time.Second)
}
To integrate Sentry into your Xcode project, specify it in your Podfile, then run pod install:
platform :ios, '9.0'
use_frameworks! # This is important

target 'YourApp' do
  pod 'Sentry', :git => 'https://github.com/getsentry/sentry-cocoa.git', :tag => '<VERSION>'
end
Initialize the SDK as soon as possible in your application lifecycle, such as in your AppDelegate application:didFinishLaunchingWithOptions method:
import Sentry // Make sure you import Sentry

func application(_ application: UIApplication,
    didFinishLaunchingWithOptions launchOptions: [UIApplication.LaunchOptionsKey: Any]?) -> Bool {

    SentrySDK.start { options in
        options.dsn = "https://<key>@sentry.io/<project>"
        options.debug = true // Enabled debug when first installing is always helpful
        // Example uniform sample rate: capture 100% of transactions for Tracing
        options.tracesSampleRate = 1.0
    }

    return true
}
Grab the Sentry JavaScript SDK:
<script src="https://browser.sentry-cdn.com/<VERSION>/bundle.min.js"></script>Configure your DSN:
Sentry.init({ dsn: 'https://<key>@sentry.io/<project>',
  // This enables automatic instrumentation (highly recommended),
  // but is not necessary for purely manual usage
  // If you only want to use custom instrumentation:
  // * Remove the BrowserTracing integration
  // * add Sentry.addTracingExtensions() above your Sentry.init() call
  integrations: [Sentry.browserTracingIntegration()],

  // We recommend adjusting this value in production, or using tracesSampler
  // for finer control
  tracesSampleRate: 1.0,

  // Set tracePropagationTargets to control for which URLs distributed tracing should be enabled
  tracePropagationTargets: ['localhost', /^https://yourserver.io/api/],
});
Grab the Sentry Python SDK:
pip install --upgrade sentry-sdkConfigure your DSN:
import sentry_sdk

sentry_sdk.init(
    "https://<key>@sentry.io/<project>",

    # Set traces_sample_rate to 1.0 to capture 100%
    # of transactions for Tracing.
    # We recommend adjusting this value in production.
    enable_tracing=True,
    traces_sample_rate=1.0,
)
Grab the Sentry React SDK:
npm install @sentry/reactWe recommend putting the Sentry initialization code into its own file and including that file as the first import in your application entry point as shown in the example below:
import { useEffect } from "react";
import * as Sentry from "@sentry/react";

Sentry.init({
  dsn: "https://[email protected]/0",
  integrations: [
  ],
  // Set `tracePropagationTargets` to control for which URLs trace propagation should be enabled
  tracePropagationTargets: [/^\//, /^https:\/\/yourserver\.io\/api/],
});
Include the Sentry initialization file as the first import statement:
// Sentry initialization should be imported first!
import "./instrument";
import App from "./App";
import { createRoot } from "react-dom/client";

const container = document.getElementById(“app”);
const root = createRoot(container);
root.render(<App />);
Add the sentry-ruby gem to your Gemfile:
gem "sentry-ruby"Configure your DSN:
Sentry.init do |config|
  config.dsn = 'https://<key>@sentry.io/<project>'

  # Set a uniform sample rate between 0.0 and 1.0
  # We recommend adjusting the value in production:
  config.traces_sample_rate = 1.0

  # or control sampling dynamically
  config.traces_sampler = lambda do |sampling_context|
    # sampling_context[:transaction_context] contains the information about the transaction
    # sampling_context[:parent_sampled] contains the transaction's parent's sample decision
    true # return value can be a boolean or a float between 0.0 and 1.0
  end
end
See -- it's really just one command.
npx @sentry/wizard@latest -i nextjsInstall the sentry/sentry package with Composer:
composer require sentry/sentryTo capture all errors, even the one during the startup of your application, you should initialize the Sentry PHP SDK as soon as possible.
\Sentry\init(['dsn' => 'https://<key>@sentry.io/<project>',
    // Specify a fixed sample rate:
    'traces_sample_rate' => 0.2,
    // Or provide a custom sampler:
    'traces_sampler' => function (SentryTracingSamplingContext $context): float {
        // return a number between 0 and 1
    }, ]);
Install the sentry/sentry-laravel package with Composer:
composer require sentry/sentry-laravelAdd Sentry reporting to bootstrap/app.php:
<?php

use Illuminate\Foundation\Application;
use Illuminate\Foundation\Configuration\Exceptions;
use Illuminate\Foundation\Configuration\Middleware;
use Sentry\Laravel\Integration;

return Application::configure(basePath: dirname(__DIR__))
    ->withRouting(
        web: __DIR__.'/../routes/web.php',
        commands: __DIR__.'/../routes/console.php',
        health: '/up',
    )
    ->withMiddleware(function (Middleware $middleware) {
        //
    })
    ->withExceptions(function (Exceptions $exceptions) {
        Integration::handles($exceptions);
    })->create();
Enable Sentry Tracing in config/sentry.php:
// Specify a fixed sample rate:
'traces_sample_rate' => 0.2,
// Or provide a custom sampler:
'traces_sampler' => function (SentryTracingSamplingContext $context): float {
    // return a number between 0 and 1
},
Run this Artisan command to configure the Sentry DSN:
php artisan sentry:publish --dsn=<paste-your-DSN-here>Add the Sentry dependency:
dotnet add package Sentry.AspNetCoreConfigure Sentry in appsettings.json.
"Sentry": {
  "Dsn": "https://[email protected]/0",
  "Debug": true,
},
Then add the SDK by simply calling UseSentry:
public static IHostBuilder CreateHostBuilder(string[] args) =>
    Host.CreateDefaultBuilder(args)
        .ConfigureWebHostDefaults(webBuilder =>
        {
            // Add the following line:
            webBuilder.UseSentry();
        });
Grab the Sentry Java SDK:
<dependency>
  <groupId>io.sentry</groupId>
  <artifactId>sentry-spring-boot-starter</artifactId>
  <version><VERSION></version>
</dependency>
Configure your DSN in application.properties:
sentry.dsn=https://<key>@sentry.io/<project>
# Set traces_sample_rate to 1.0 to capture 100%
# of transactions for performance monitoring.
# We recommend adjusting this value in production.
sentry.traces-sample-rate=1.0
Grab the Sentry Vue SDK:
npm install @sentry/vueConfigure your DSN:
import { createApp } from "vue";
import * as Sentry from "@sentry/vue";

const app = createApp({
  // ...
});

Sentry.init({
  app,
  dsn: "https://<key>@sentry.io/<project>"",
  // This enables automatic instrumentation (highly recommended),
  // but is not necessary for purely manual usage
  // If you only want to use custom instrumentation:
  // * Remove the BrowserTracing integration
  // * add Sentry.addTracingExtensions() above your Sentry.init() call
  integrations: [Sentry.browserTracingIntegration()],

  // We recommend adjusting this value in production, or using tracesSampler
  // for finer control
  tracesSampleRate: 1.0,
  // Set tracePropagationTargets to control for which URLs distributed tracing should be enabled
  tracePropagationTargets: ['localhost', /^https://yourserver.io/api/],
});

app.mount("#app");
Get started with just one line of code:
npx @sentry/wizard@latest -i angularTo use the SDK, initialize Sentry in your Solid entry point index.jsx before you render your Solid app:
// index.jsx / index.tsx

import * as Sentry from "@sentry/solid";
import { useBeforeLeave, useLocation } from "@solidjs/router";
import { render } from "solid-js/web";
import App from "./app";

// Initialize the Sentry SDK here
Sentry.init({
  dsn: "__DSN__",
  integrations: [Sentry.browserTracingIntegration()],

  // Performance Monitoring
  tracesSampleRate: 1.0, //  Capture 100% of the transactions
  // Set 'tracePropagationTargets' to control for which URLs trace propagation should be enabled
  tracePropagationTargets: ["localhost", /^https:\/\/yourserver\.io\/api/],
});

const app = document.getElementById("app");

if (!app) throw new Error("No #app element found in the DOM.");

render(() => <App />, app)
To use the SDK, initialize Sentry in your Svelte entry point main.js before you bootstrap your Svelte app:
// main.js / main.ts

import App from "./App.svelte";

import * as Sentry from "@sentry/svelte";
import { BrowserTracing } from "@sentry/tracing";

// Initialize the Sentry SDK here
Sentry.init({
  dsn: "__DSN__",
  release: "[email protected]",
  integrations: [new BrowserTracing()],

  // This enables automatic instrumentation (highly recommended),
  // but is not necessary for purely manual usage
  // If you only want to use custom instrumentation:
  // * Remove the BrowserTracing integration
  // * add Sentry.addTracingExtensions() above your Sentry.init() call
  integrations: [Sentry.browserTracingIntegration()],

  // We recommend adjusting this value in production, or using tracesSampler
  // for finer control
  tracesSampleRate: 1.0,

  // Set tracePropagationTargets to control for which URLs distributed tracing should be enabled
  tracePropagationTargets: ['localhost', /^https://yourserver.io/api/],
});

// Then bootstrap your Svelte app
const app = new App({
  target: document.getElementById("app"),
});

export default app;
Just run this command to install and register Sentry's Astro integration.
npx astro add @sentry/astroAnd add your DSN and project config to your astro.config.mjs file:
import { defineConfig } from "astro/config";
import sentry from "@sentry/astro";

export default defineConfig({
  integrations: [
    sentry({
      dsn: "__DSN__",
      sourceMapsUploadOptions: {
        project: "your-project-slug",
        authToken: process.env.SENTRY_AUTH_TOKEN,
      },
      tracesSampleRate: 1.0,
    }),
  ],
});FAQs
You can monitor a recurring job of any type through check-ins that notify Sentry when a job has started, finished, or if it ran successfully or failed.
You can set up Crons with only a few lines of code. Your existing SDK + DSN can be used for configuration.
Yes, we provide integrations for Celery and Next.js that automatically set up monitors, or you can use our REST API to configure them on your first check-in.
Crons records each job's start time and end time, duration, and automatically tracks any errors thrown during execution.
Of course we have more content


Get monthly product updates from Sentry
Sign up for our newsletter.
And yes, it really is monthly. Ok, maybe the occasional twice a month, but for sure not like one of those daily ones that you just tune out after a while.
Fix It
Get started with the only application monitoring platform that empowers developers to fix application problems without compromising on velocity.